Google Analytics can give you some insightful user data and valuable information on how people are behaving on your website. With so much information available, it can sometimes seem like a minefield, so I’m going to show you five ways to get the most from Google Analytics, and how to use it to improve your e-commerce conversion rate.
1. Exit Pages
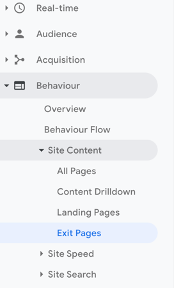
I always say if you’re looking to find where users are struggling on your site, the first place to start is to ‘head for the exit’. By this, I’m referring to the Exit Pages report in Google Analytics.
This report will show you the pages on your website where users are leaving your site. If you know the pages where most users are exiting your site, you can start to look into the reasons WHY they are exiting and make changes to encourage them to hang around.
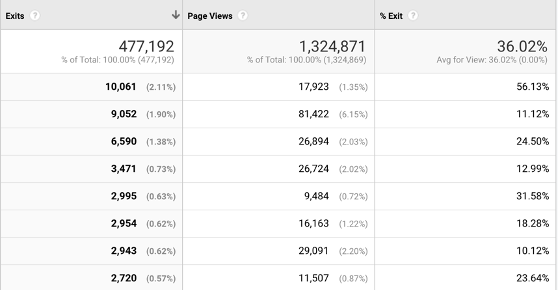
You would expect your homepage to be top of the pile, and in an ideal world your thank you page would be right up there too. To identify which pages need a closer inspection, take a look at what the site average is for your site and identify the pages that are significantly higher than this average.
The main metric we’re looking at in this report is the % Exit figure; this is the % of users who have exited the site while on this page. Pages that have an unusually high exit rate can instantly highlight, areas where users are struggling – why are so many people leaving?
2. Bounce Rates
I like to use bounce rates as an indicator of how engaged traffic is. If the quality of the traffic is good and users are engaged, bounce rates will be low. If they’re not, it can be an indicator that either the traffic is poor, or that engagement levels on the page are very low.
Google suggests that the average website bounce rate is about 41%. I always use this as a benchmark, but not necessarily a pointer that something needs further investigation. When looking at individual pages, I find it much better to compare to the site average rather than Google’s target KPI. A site might have a low average bounce rate and have a page that just isn’t performing, yet the bounce rate may well be inside Google’s 41% suggestion.
If a page has a high bounce rate and a high exit rate, then the first thing to do would be to eliminate the possibility that the traffic was poor quality. If the traffic is not your target audience, then users just won’t hang around. Is this a landing page? If so, is the bounce rate unusually higher for one traffic source? This is a tell-tale sign that it’s a traffic issue – I see it quite a lot with Facebook Ads.
If you’re confident the traffic is good quality, then the issue is most likely to be around engagement. The obvious questions to be asking here are around messaging. Is it clear what the page is about? Is the content of the page in line with what users are expecting? Is there enough information to make the user want to hang around and find out more?
At this stage, I would look to install some tracking software like HotJar on the page and take a look exactly how users are behaving on the page. HeatMaps and user videos can often shed light on why bounce rates are too high.
3. Behaviour Flow
The behaviour flow tool gives a graphical representation of how users flow through your site. This visual aid can highlight areas in which users are dropping off from the site.
Take a look at the screenshot below. Almost 99% of traffic that hits this page is dropping off and leaving the site at this point. One thing to consider here is that this is a blog post; and while I would expect a high drop off, I wouldn’t expect it to be so high.
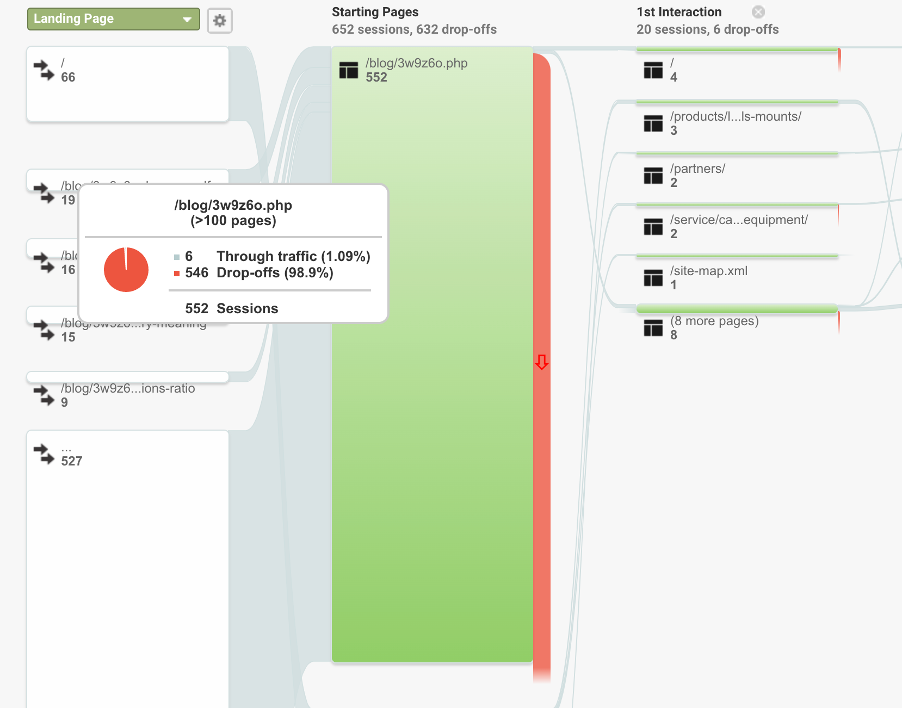
Users are reading the post, getting to the end of it and then leaving – this is a shame and a waste. In this instance, we should be looking at ways of encouraging users to be sticking around, pointing them in the direction of other content and information they might find useful and at the very least, trying to promote some kind of engagement like social sharing or some type of lead magnet to collect the user’s email address.
4. Shopping Behaviour
Shopping behaviour aimed at e-commerce sites and is very much like behaviour flow in that it helps you identify, at a glance, where users are dropping off. It categorises page views into products, basket sessions, checkout sessions and transactions.
By visualising your sales funnel in this way you identify, by page type, where there may be holes.
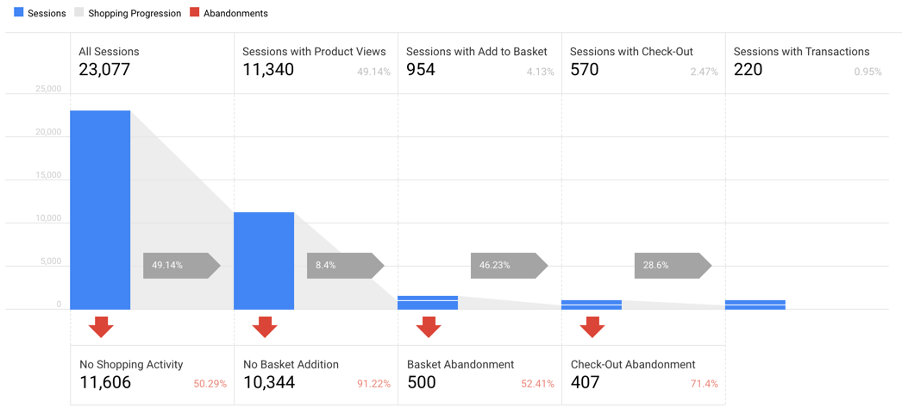
Here we can see that this site has 91% of visitors who viewed products, did not add anything to their basket – I would expect this figure to be around 75% or lower. We can also see that checkout abandonment is as high as 71% – Anything over 55% would get my attention.
Straight away, we can see that if we want to increase conversion rates, we need to get more users adding products to basket and stop fewer users from leaving during the checkout process. I would start at the checkout and find out why users are dropping out here. If they have already added a product to the basket, there was an intent of some sorts there, so let’s find out what spooked them.
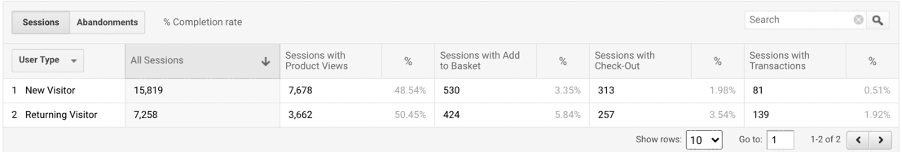
5. New Vs Returning
My final tip on how to get the most out of Google Analytics lies in New Vs Returning. New Vs Returning can reveal a lot about where your user is in the user journey. For me, it is an absolute gold mine, yet it’s quite often overlooked.
You would always expect returning traffic to have a higher conversion rate. These users are already familiar with your brand and site, so it makes sense that a higher proportion of them will convert.
If a website has similar conversion rates for new users as it does returning visitors, it suggests that many users are making purchases based on impulse. If however, a site has a low conversion rate for new users and a very high conversion rate for returning visitors, it suggests that the purchase is a considered one.
If that ratio of new vs returning is higher than 1:2 in favour of returning then it is safe to say that you stand a much better chance of converting the user if you focus your attention on the nurturing process between visits – by this I mean your retargeting efforts.
In the example below, the ration is around 1:4.
An excellent way to bridge this gap is to try and answer concerns and reasons people don’t buy from you in your retargeting. Your FAQ section is a great place to start. If you get asked lots of questions about delivery times and returns, you may, as part of an ad sequence push that you have free next day delivery and hassle-free returns.
If you can overcome objections you stand a much better chance of bringing more users back to the site, and you know from the data, that you have a much better chance of converting them the second time around.
There is so much more to Analytics than these tips. It can help in many different aspects of your marketing, and I do hope that you can pull just one nugget of information on these five ways to get the most out of Google Analytics.